Have you ever thought about the fact that almost all books on native plants define their ranges as “Native in the Northeastern US and Southern Canada”, or “Native in the Midwest States and Southern Prairies”? Very few plants are native throughout those rather large areas of geography. Soil type, microclimates, even underlying geology can have a great influence on which plants would be found naturally in any given location. Wouldn’t a map be much more accurate and useful? After all, native plant gardeners, more so than any other, want to know if a plant is actually native to where they live. In this month’s article I will try to explain why range maps are not very common, why they are a challenge to create, and why they can be a challenge to interpret.
There are at least 3 reasons why range maps are rarely found in the guides. The first of these is that, with the exception of a few plants that have been studied extensively (e.g. Goldenrods in the Astereae Lab at the University of Waterloo), a lot of the native plants we want to grow in our gardens have historically garnered very little interest from a geographical perspective. We may have studied the ecology of the plant (how it interacts with its environment), its physiology, and in some cases we may even have brought it into the greenhouse to produce cultivars. But, for the most part, we’ve been more concerned with the plant itself than with knowing where to find it (beyond what kind of soil/light regime it can be found in – prairie, forest, etc.). This means that we just don’t have readily available data to create reliable range maps.


The second problem is that the collection of locational data to determine native ranges is, by necessity, a historical one. In the past 150-200 years we have moved plants all over the place, well beyond their native ranges. This means that it is a lot trickier now to determine if that plant has always been here, or if it has just escaped from someone’s garden. We rely on early botanists’ recordings of what they saw, and where they saw it.
However, even though the historical records are extensive, they aren’t always 100% accurate. Modern botanists often debate whether so-and-so’s sighting of this plant or that accurately represent where the plant was found before Europeans arrived. Echinacea purpurea, for instance, is usually considered native in parts of Michigan, but some argue that the historical records indicate it was only found in areas not far from railway corridors. Does this mean those plants were simply the result of seeds brought in inadvertently by rail? Or maybe that their mapped location is a case of the botanists recording those sites, but not venturing further afield to see that the plant existed elsewhere. Keep in mind that at the time many of these botanists were working, there were few roads and lots of wilderness.


The third, and perhaps biggest challenge, is determining what scale to use to map the ranges. Some maps are created at a small scale (i.e. they cover a large area). By necessity, details get obscured at these scales. If we map, say, the range of Agastache scrophulariifolia (Purple Giant Hyssop) at the North American scale, as shown in the 1945 map from The American Midland Naturalist journal (Vol 33, No. 1), we can see that the mapping is very generalized and doesn’t take into account variations in local landscapes or microclimates.


At the other end of the spectrum (large-scale mapping), we are zoomed in close (so everything looks larger – hence its name), but these maps have their own issues. Perhaps the biggest of these is that many people looking at such a map believe that the boundary shown is a hard boundary – that the plant is definitely found on one side of the line and not found on the other side of it. Therefore the map-maker runs the risk of using vague data to create the illusion of clear and precise knowledge. As a former map-maker, I know only too well the challenges.
It is extremely difficult to generate a map showing where a plant was native over a large area and yet still capture small isolated pockets. In the map I created (below) for Green Milkweed (Asclepias viridiflora), you can see that it covers a large contiguous area in a band from southern Lake Michigan, crossing southern Ontario, into Ohio, Pennsylvania and beyond (shown with striped shading). Yet if you look closely, you’ll see a couple of small pockets of stripes – one further north along the Lake Michigan shoreline, and another just north of Manitoulin Island in Ontario. The second of these locations, in particular, is extremely exaggerated in area. In fact, the plants were only found in a small, isolated area that would not even have shown up at the scale of this map. The dilemma is, then, whether to exaggerate the area, or to leave the impression that the plant was never found that far north.


When you combine all of these reasons, you get a better feel for the amount of work involved to 1. verify the native ranges, and 2. determine what scale to map them at, and what information to include or leave out. All such maps, by necessity, are generalizations because you can’t easily account for small, localized variations. As a result, few people have tried to do it.
Then, of course, there is the whole business of interpreting the range maps once they ARE made. The authority I use to determine if a plant is native to Ontario is the Database of Vascular Plants of Canada (VASCAN). However, all the maps on their website show nothing more than IF the plant is native SOMEWHERE in Ontario. For instance, Pulse Milk-Vetch (Astragalis tenellus, aka Astragalis multiflorus) is shown as native to Ontario. However, that is based on one, small, localized occurrence in northern Ontario, as shown in this map from the Atlas of Rare Vascular Plants of Ontario.
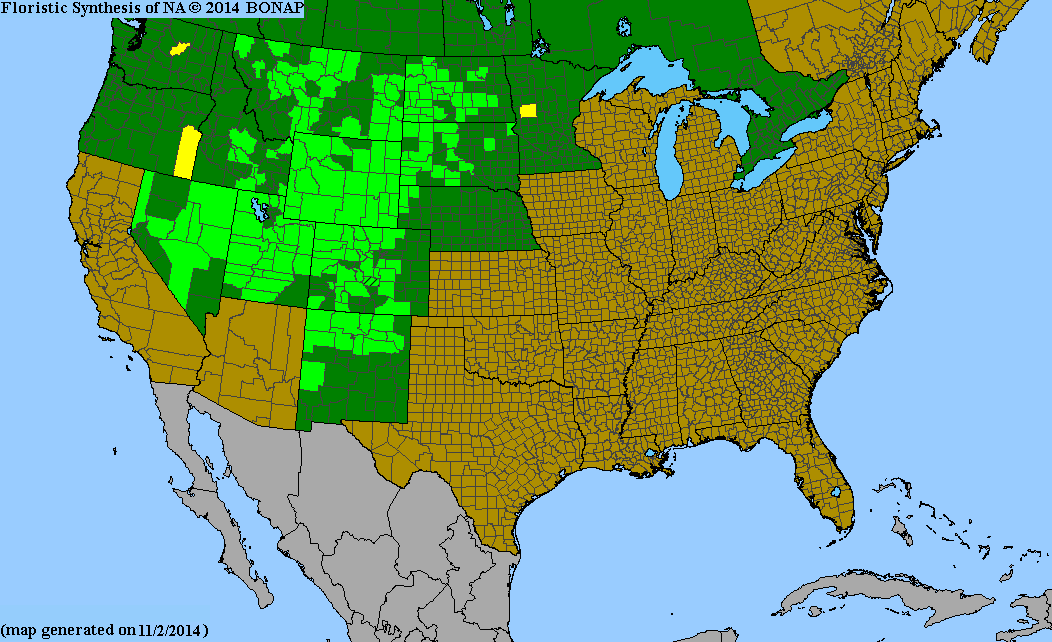
South of the border, plant species have been mapped to the county level, in most states. However, it is often unclear if these maps represent current locations or historical (i.e. native) ranges. In the map of the same plant (identified as Astralagus multiflorus) from the Biota of North America Program (BONAP) website, the bright green indicates the counties where the plant is known (in the US) but in Canada that level of mapping has not been done, so the entire province of Ontario is shown in dark green. This could lead some people to think that it is found throughout the province.


Before you can decide that a plant is native to where you live, you need to check multiple sources and put together a picture. For those in southwestern Ontario, at least, an excellent resource is Michael Oldham’s 2017 “List of the Vascular Plants of Ontario’s Carolinian Zone (Ecoregion 7E)” that you can download here. It gives a county-by-county breakdown of where the plants are considered to be native.
Shaun Booth (from In Our Nature) and I have been working on a reference book for native plant gardeners and we have taken on the task of mapping the native ranges for over 200 species of plants in the southern Great Lakes region. Over the past 4 years or so, we have compiled historical records as well as on-line data, and then worked with expert ecologists in the province and adjoining states to verify our maps. We are currently working on finding a publisher so that you, too, can have access to this information. Wish us luck.